Design for Understanding
Data Visualization for Billionaires
Introduction
This group project uses visual methods to communicate data for two different goals: (1) present data in an unbiased and in-depth way; (2) present data in a persuasive and compelling way. Hence, in this blog, I will first introduce the dataset and tool we utilized. And then, I will illustrate how we brainstorm, sketch and realize our designs. At last, I will present the final visualization with a demo video to show our work.
Dataset & Technology
The dataset we choose is Billionaires from the CORGIS Dataset Project. Building on the Forbes World’s Billionaires lists from 1996–2014, this dataset contains 22 features and 2617 entries.

Features in the dataset include the 5 different types of information:
- basic information (e.g., name and rank)
- company information (e.g., company name and company type)
- demographic information (e.g., age and gender)
- location information (e.g., citizenship and company location)
- wealth information (e.g., wealth worth and wealth category)
The tool we used to create the visualization is Tableau. The reason is threefold:
- Tableau enables users to create more than 20 types of charts without coding quickly. So we could focus on the design of the visualization.
- Tableau allows users to connect every figure and create a dashboard with customizable interactive actions.
- We could share our work publicly on Tableau public, which will create a link and embedded code for us. With the embedded code, it would be easy for us to put our work on our website.
Besides, to make our work public, we adopt Heroku as our website host service since it can be connected to Github and update the website in real-time.
Design Process
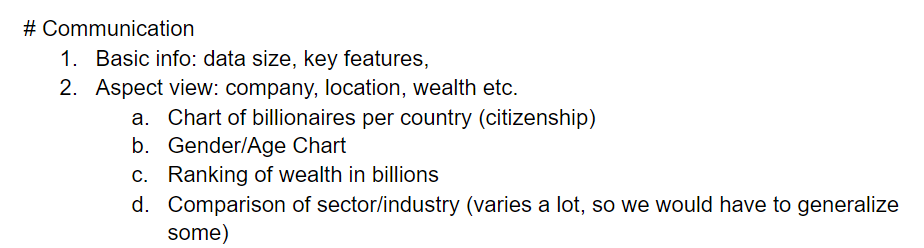
Inspired by the five design-sheet, we first created a shared document to gather our thoughts on this project. I worked on the clear communication and reasoning part. For the communication part, we need to create objective and unbiased visualization for the dataset. After discussing with teammates, we decided to focus on the most essential features in the dataset, such as regional distribution, gender/age chart, sector/industry distribution, and billionaires ranking.
The next step of our design process is the initial designs. We created sketches for the charts we discussed in the previous step. And we compare the advantages and disadvantages of each chart.

Besides the design sheet, we also asked classmates for suggestions during the design process. And we received several valuable feedbacks:
- Using treemap instead of the world map to present the regional distribution since the world map might be too sparse if some countries do not have as many billionaires as the others.
- Using the two-sided bar chart instead of the vertical bar chart in different colors to present the gender/age info since it would be easier for the audience to see the contrast.
- Adding more connections to charts such as the industry wealth worth chart and top-ranked billionaires chart.
Based on our design sheet and the feedback, we decided to create 7 charts to present the data: regional distribution treemap, wealth worth area chart, industry wealth worth bar chart, top-ranked billionaires table, gender/age bar chart, billionaires distribution by industry and by sector. It is worth noting that most of the charts are interactive, which means that if we click on one label on specific charts, the other charts will change accordingly to show the filtered data.
Data Visualization
After we decided on the charts and layout, we started to realize our design in Tableau. I created the following 4 interactive charts for this project.

The Regional Distribution treemap shows how many billionaires are in each country from 1996 to 2014. The size of each country is determined by the number of billionaires in that country. Detailed information will show up when the mouse is hovering over the country. For example, the United States has 657 billionaires and 123 companies founded with a total wealth worth of 3,542 billion.
The Wealth Worth Area Chart gives the wealth worth in each industry. Different colors represent different industries, and all industries are sorted in descending order in terms of wealth worth. For example, the wealth worth of the Consumer industry was 364 billion in 2001.
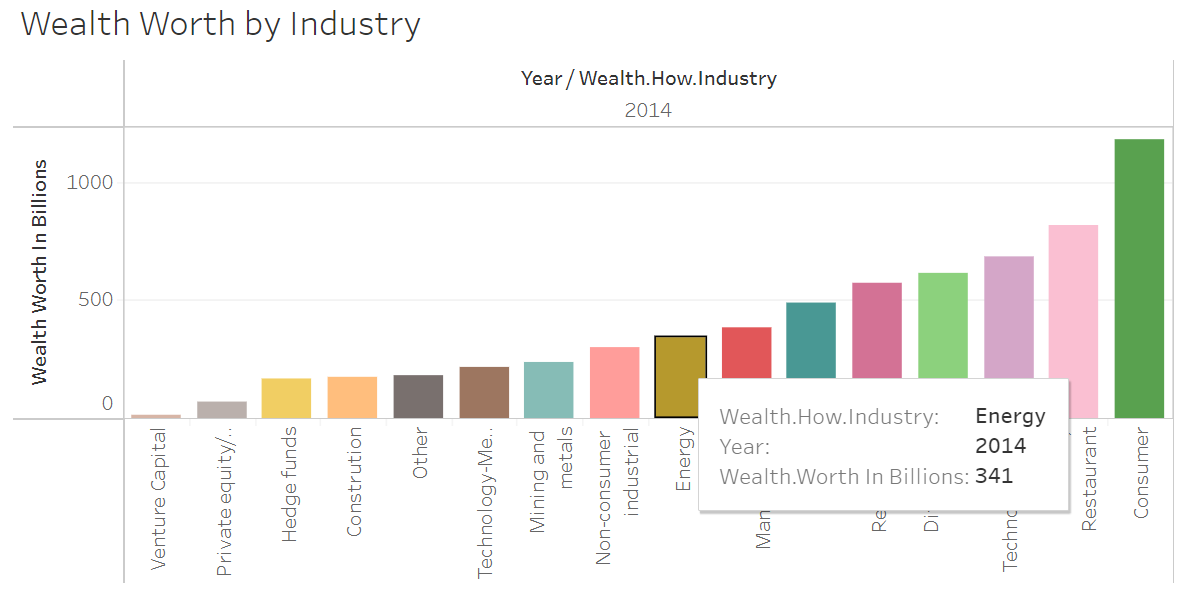
The Industry Wealth Worth Bar Chart presents the wealth worth information on each industry. It is connected to the Wealth Worth Area Chart. If we click on the year label on the x-axis of the area chart, the industry wealth worth bar chart will show the detailed information of all industries in the year we choose accordingly. For instance, the wealth worth of the Energy industry is 341 billion in 2014.


The last chart I created is the Top-ranked Billionaires Table, which gives the name, company name, company sector, and year of the rank of the top 10 billionaires. This table is connected with both Wealth Worth Area Chart and Industry Wealth Worth Bar Chart. The rank list will change correspondingly if the year label in the area chart or/and industry bar in the bar chart changes. For instance, if we select ‘2014’ as the year label, and ‘Technology-computer’ as the industry bar, we can see the richest person in the technology-computer industry in 2014 is Bill Gates.
Communication & Persuasion
This project contains two different portraits of the same dataset. During the design process, I found that the focus of the two sides is very different. For the communication part I worked on, we put a lot of effort into objectively describing the statistical facts without any personal understanding. Our goal is to tell the audience what the dataset is about, what important features are in the dataset, and what kind of data they could expect from the dataset.
However, for the persuasion part, their goal is to tell a story they observe or generalize from the dataset. Hence, their design should be interesting and compelling, attracting the audience as much as possible. Unlike the communication part, the story could be subjective and may vary depending on the storytellers.
Final Work & Demo
We hosted our work on Heroku, which is publicly accessible by any user. The final work can be found here.
Also, we made a demo video for the project to better present the interactive features:
Conclusion
This group project provides a great opportunity for me to learn about data visualization, especially the difference between clear communication and persuasive communication. The final work is not ideal due to the time limit. If we have more time, we could improve the design of the website to better present our final work.